
The Go SDK has been including test coverage reports since Go 1.2.
How can we obtain a time graph of test coverage, without needing a SaaS service?
The simples solution to get a graph of coverage over time is obviously to use an off-the-shelf SaaS, like Code Climate, CodeCov ♡, or Coveralls.io.
This is quite a convenient solution for Open Source projects, but may become costly and not always be acceptable to some organizations handling proprietary code.
Jenkins has one with its Cobertura plugin, but GitLab does not: it only provides a bage showing the global coverage rate of the branch head, nor does CircleCI, which refers to CodeCov and Coveralls in its documentation.
However, organizations unwilling to use these services will usually have an
established observability solution: why not us it ? This is the idea behind
gocoverstats.
How can I produce covrage reports with GoCoverStats ?
This is a 3-step process:
- create a standard coverage data set with
go test, - format it with
gocoverstats, to produce:- either a simple global rate
- or a per-package coverage rate table
- push these results to an existing metrics tool
$ go install gitlab.com/fgmarand/gocoverstats@latest         # Download gocoverstats
$ go test -coverprofile=coverage.txt -covermode=atomic ./... # Create the coverage data file
$ gocoverstats -f cover.txt                                  # Extract the global coverage rate...
0.953
$ gocoverstats -v -f cover.txt                               # ...or a per-package table
2021/12/11 21:02:07 loaded 2 profiles                        # This line goes to stderr
github.com/owner/repo/package1 0.950                         # Those results go to stdout
github.com/owner/repo/package2 0.981
Global, unweighted             0.953
$
Once the data have been sent out as metrics, all that remains is to use the chosen metrics tool to actual draw the graphs. Let us see two such mechanisms: DataDog and Graphite.
How to plot test coverage in DataDog?
In order to publish a simple global coverage rate to a DataDog dashboard :
- Install the DataDog Python library, following their documentation
- Either configure the
~/.dogrcfile, or theDATADOG_API_KEYenvironment variable, with an API key. - Emit the aggregate rate as a single metric:
dog metric post foo_project.coverage $(gocoverstats -f coverage.txt)
To go one step further and plot one curve per package, use the same
dog command, but in a script loop:
| |
Once the data has been acquired by DataDog, all that remains to do is create a widget
in some dashboard. Plus multiple lines for the foo_project.coverage metric,
varying on the package tag (cf. ligne 7).
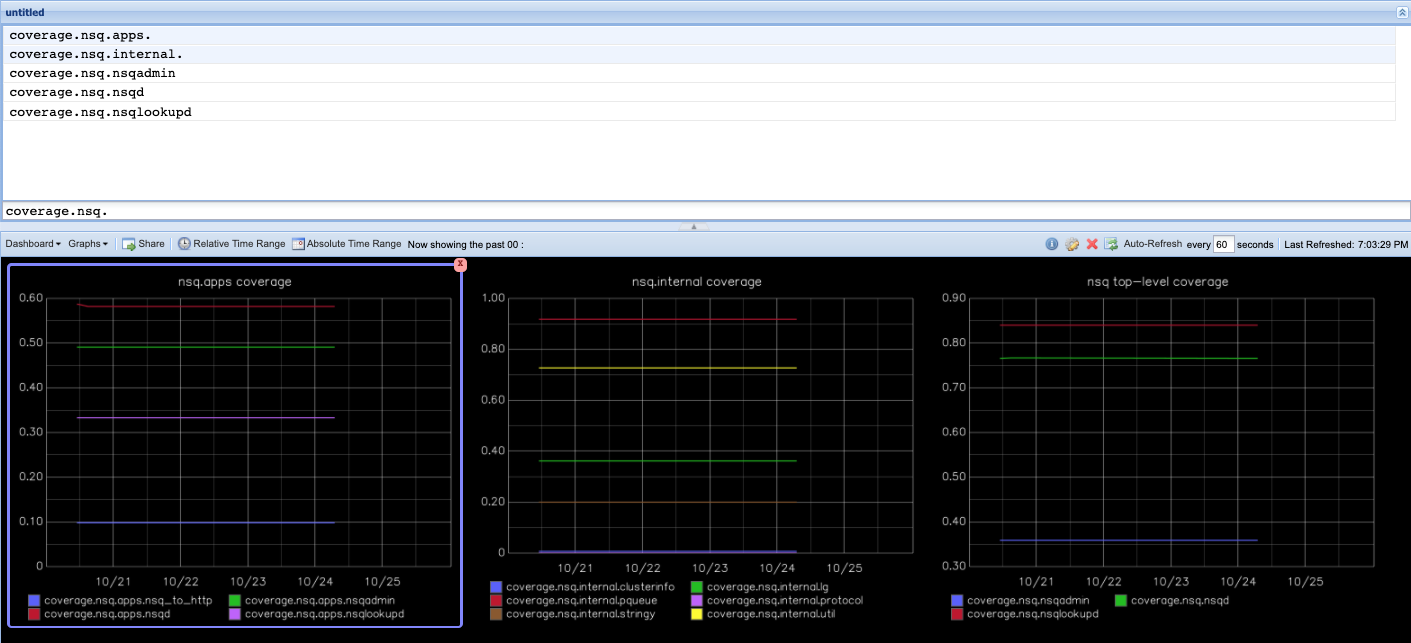
How to plot test coverage in Graphite?
Let us check an example with the nsq.io project.
$ go test -race -coverprofile=cover.txt ./... > /dev/null
$ gocoverstats -f cover.txt -v 2> /dev/null | grep -v unweighted
github.com/nsqio/nsq/apps/nsq_to_http      0.098
github.com/nsqio/nsq/apps/nsqd             0.587
github.com/nsqio/nsq/internal/clusterinfo  0.007
# ...snip...
$
The simplest format to push metrics to Graphite is the Carbon test format protocol:
<name>.<space>.<metric> <value> <timestamps>
Since that looks a lot like the gocoverstats output, a few lines of shell scripting
will allow us to push the metrics using just nc, without requiring any specialized
client:
| |
All that remains to be done is designing the dashboard in Graphite, possibly like this example.
Additional resources
- Official introduction of the Go coverage reporting tools: https://go.dev/blog/cover
- The GoCoverStats project: https://gitlab.com/fgmarand/gocoverstats
- The
carbon.bashscript to publish the GoCoverStats output to Graphite via Carbon. - The
datadog.bashscript to publish the GoCoverStats output to DataDog